Asset Health Management

# Residual Useful Life Estimation | # Deep Learning | # Digital Transformation | # IIoT | # Industry 4.0

Detailed description with code is avaliable here.


Rapid adoption of renewable energy sources, changes in regulatory environment with the implementation of SCED/MBED, stringent enviromental norms are putting immense pressure on operation of thermal power plants. The above externalities are forcing increased cyclic operation of thermal fleets, wherein frequent start up and shutdowns are causing varying load on assets like boilers, feed pumps, motors. Under such conditions, ensuring availiablity and safety of equipments is of prime significance. Consequently, utilities needs to strategize for a transition from a reactive maintenance approach to real time condition based health management eventually leading to preventive maintenance (PdM).

This webpage illustrates estimation of residual useful life (RUL) of an equipment using deep learning. The equipment is operating normally at the start of each time series, and develops a fault at some point during the series. In the training set, the fault grows in magnitude until system failure. In the test set, the time series ends some time prior to system failure. The objective is to predict, "What is the probability that the equipment will fail in the next n cycles/days?".

A datascience based process is utilized for predictive maintenance. The steps include preparing the dataset, visually exploring it, partioning the dataset for training and validation, validating the models using unseen dataset. The detailed process with code is available here. . A boiled down interactive demo/illustration is explored below.

Towards Multi-Sensor Approach

Generally, conditioning monitoring of a machine is done by looking at a sensor measurement (Eg. Temperature, Vibration ) and imposing bounds to it, i.e. under normal operating conditions, the measurement values are bounded by a maximum and minimum value (similar to control charts). Any deviation in the defined bounds sends an alarm. This is often generally defined as anamoly detection.

However, this method often sends false alarms (false positives) or misses an alarm (false negative). Furthermore, a single signal is observed/analysed in isolation. For example, an alarm may sound if the temperature exceeeds a certain level. A system defined above often cannot look at mutiple parameters and come to a conclusion about the state of a machine. Or technical parlance, one cannot take advantage of the multi-dimensionality of the data.

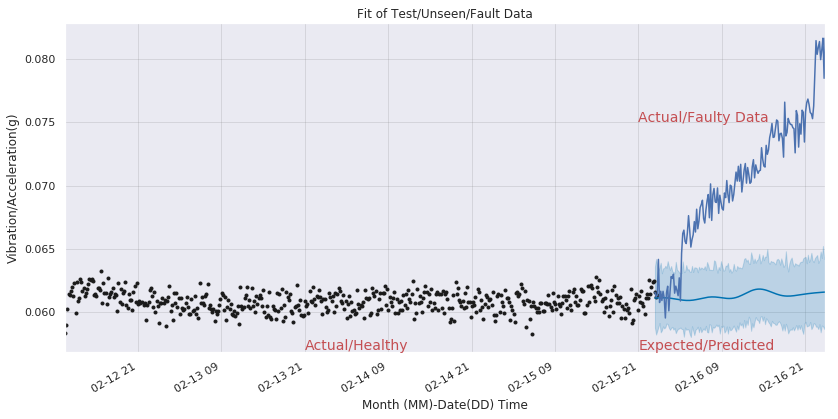
Anamoly detection using a one variable (vibration in a bearing dataset) is explored in detailed in my blog article. By analysing past trends of healthy (black points in graph), the model learns the expected trend with acceptable variance .A trained model predicts the trends for the future (The blue line represents the expected values from 2004-02-15, 23:42:39 with the light blue portion showing the acceptable variance) and if any deviation is observed, an alarm can be raised.

Broken Link. My apologies!


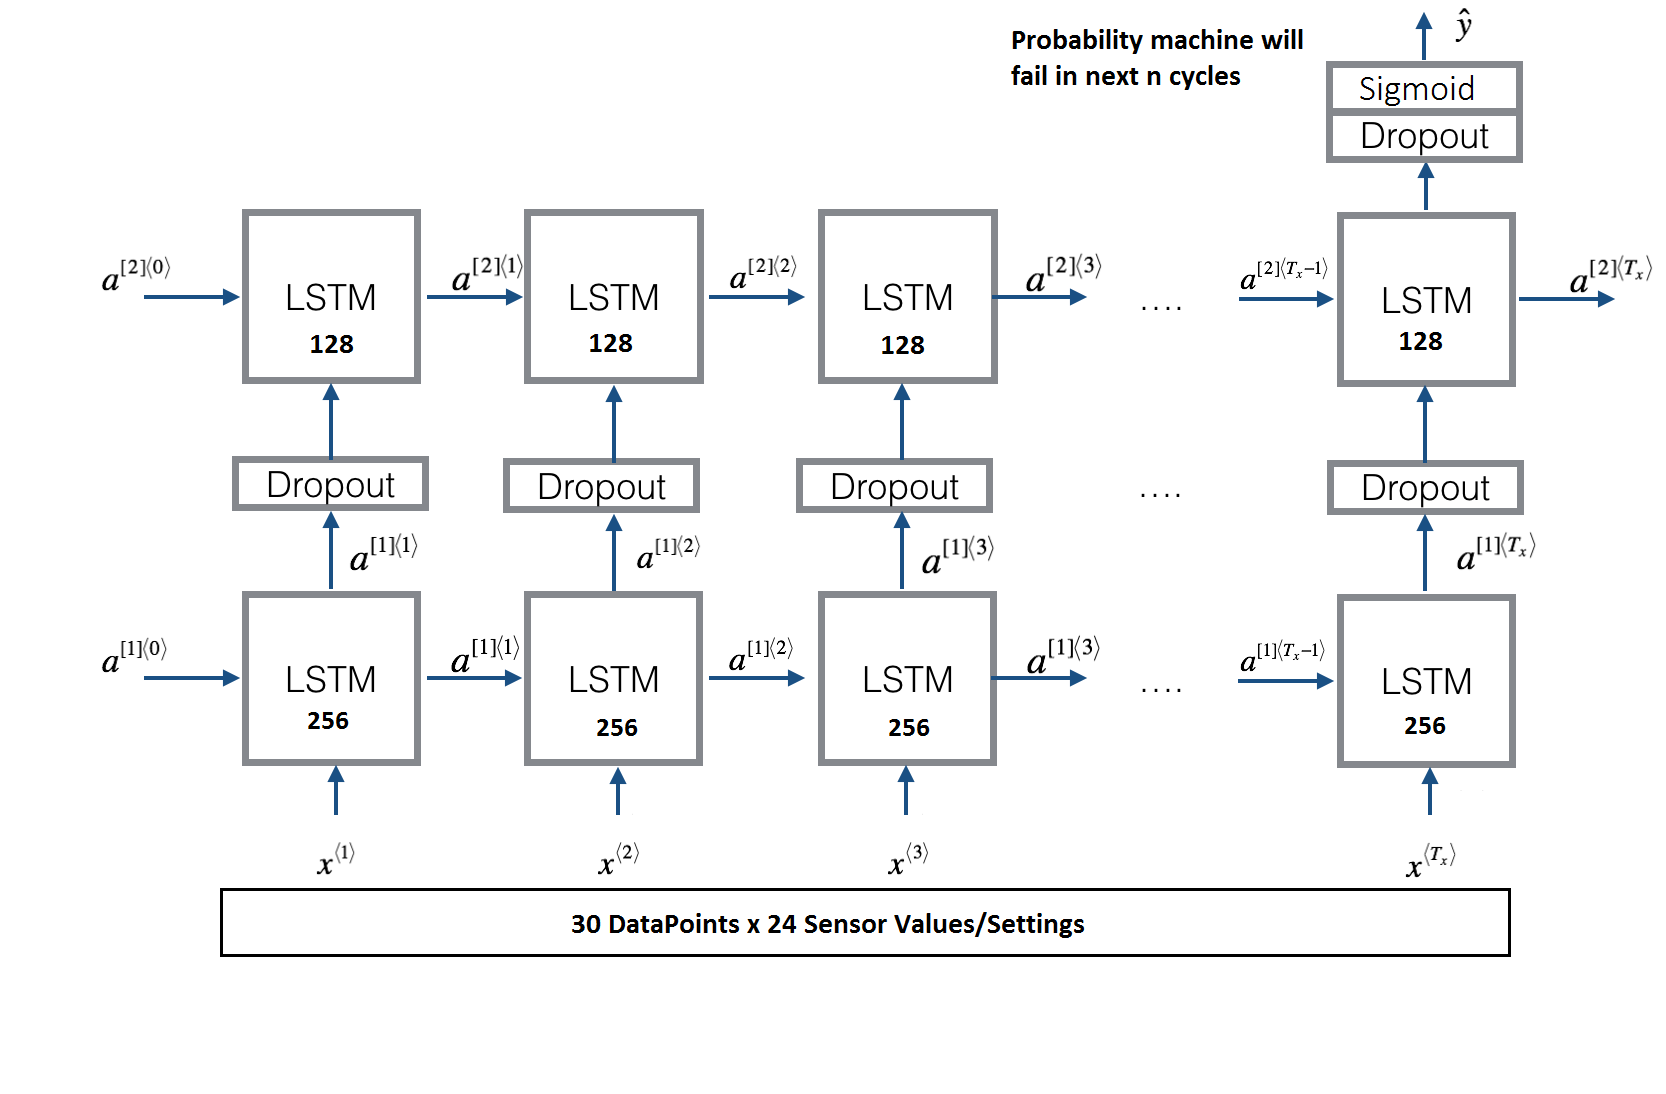
The same principle hold true for analysing multiple signal (multi-dimensional) at a time and creating a single metric like, the health score/ residual useful life of a machine. The following sections demos one such illustartion of analysing multiple signals (multi-dimensional) to guage " What is the probaility the equipment will fail in next n cycles?"

Visualize Multi-Sensor Data

Sensor Data is recorded for a fleet of engines of the same type (100 in total). Data sets consists of multiple multivariate time series. Each time series is from a different engine – i.e., the data can be considered to be from a fleet of engines of the same type. Each engine starts with different degrees of initial wear and manufacturing variation which is unknown to the user. This wear and variation is considered normal, i.e., it is not considered a fault condition. There are three operational settings that have a substantial effect on engine performance. These settings are also included in the data. The data is contaminated with sensor noise.

Total number of sensor measurements : 21 | Total number of operational settings : 03

The interface may be used to select and visualize sensor readings. Out of 21, select sensors are only used for visualisation here. While creating model, all 21 sensor measurement and 3 operational settings are used.

Use dropdown to visualize snapshot of multi-sensor data of an Engine. Note: Sensor values have been normalized.

Deep Neural Net

Once the training data is cleaned, wrangled (Details in blog/GitHub), a model can be created learning from data.Deep learning is an aspect of artificial intelligence (AI) that is concerned with emulating the learning approach that human beings use to gain certain types of knowledge.

To understand deep learning, imagine a toddler whose first word is dog. The toddler learns what a dog is (and is not) by pointing to objects and saying the word dog. The parent says, "Yes, that is a dog," or, "No, that is not a dog." As the toddler continues to point to objects, he becomes more aware of the features that all dogs possess. What the toddler does, without knowing it, is clarify a complex abstraction (the concept of dog) by building a hierarchy in which each level of abstraction is created with knowledge that was gained from the preceding layer of the hierarchy.

Refering to the above analogy, for the case of prediction of whether a machine will fail in the next n cycles?, a deep learning model will observe examples with failures (training data), extract out features that will suggest that the machine is going to fail in next n cycles, similar to that of a toddler becoming aware of the features that dogs possess (tail, legs). For machine failures, traditionally skilled operators were able to discern such failures by observing sound of the machine or other features which they have gained through experience. Unlike the skilled operator or toddler, who will take year/months to understand the concept of "machine failure"/dog, a computer program that uses deep learning algorithms can be shown a training set and learn the skills.,With each observation and iteration, the model the computer creates becomes more complex and more accurate. To achieve an acceptable level of accuracy, deep learning programs require access to immense amounts of training data and processing power, neither of which were easily available until the era of big data and cloud computing.

A Sequential model is selected which connects each layer and pass the data from input to the output during the training process. In order for the model to learn time series data which are sequential, recurrent neural network (RNN) layer is created and a number of LSTM cells are added to the RNN. The scheme is represented below.

Broken Link. My apologies!


Prediction

Based on the model created for engine, it is possible to predict whether the engine will fail in the next 30 cycles. A sample of data points from a test data set (data not seen by model) is provided as follows

  1. Sample 1 - Engine A - Healthy State
  2. Sample 2 - Engine A - End of Life State
  3. Sample 3 - Engine B - Healthy State
  4. Sample 4 - Engine B - End of Life State
  5. Use dropdown to select sample data

The Road Ahead

The above demo showcases how asset health can be monitored based on telemetry data and how machine learning models can be deployed for failure predictions. The next step is to move from individual asset failures to entire portfolio of machines.

For example, an machine learning model defined above can be deployed for boiler feed pump (BFP) of a thermal power plant, Condendate Extraction Pump (CEP) and other equipments in the path of a the condensate feed water system. Such models can be aggregated for a health score of entire condensate feed water system. Such aggregation can transalate to health scores for entire asset portfolio, to subsystems and ultimately health/risk scores for entire systems like CHP, AHP, WTP systems etc.

Often the emphasis is on civil works and commissioning of the plant so that commerical operation is declared on time and other parts of the project are deemphasized or ignored that have longer-term benefits like installing sensors, telemetry, connecting to SCADA systems, and utilizing the full capabilities of the SCADA system. These systems enable condition monitoring of equipment and data analytics to optimize performance and reduce life cycle cost. (ADB, IoT in Power Sector)

Achieving such systems for predictive maintenance (PdM) requires an open system architecture for collection and storage of data through IIoT technologies, requires deploying machine learning, AI and other predictive models, a visualization dashboard for end users The generation sector can benefit from this digital transformation from the convergence of operational technolgies (OT), informational technolgies (IT) and Artificial Intelligence.